Viewing Maps
Quick Summary
There are several ways a Map View can be accessed. See Maps.
Viewing Shortcuts
Zoom in and out using the mouse wheel.
Move around the map by clicking and holding down the mouse button as you move the mouse.
Map Viewing Options
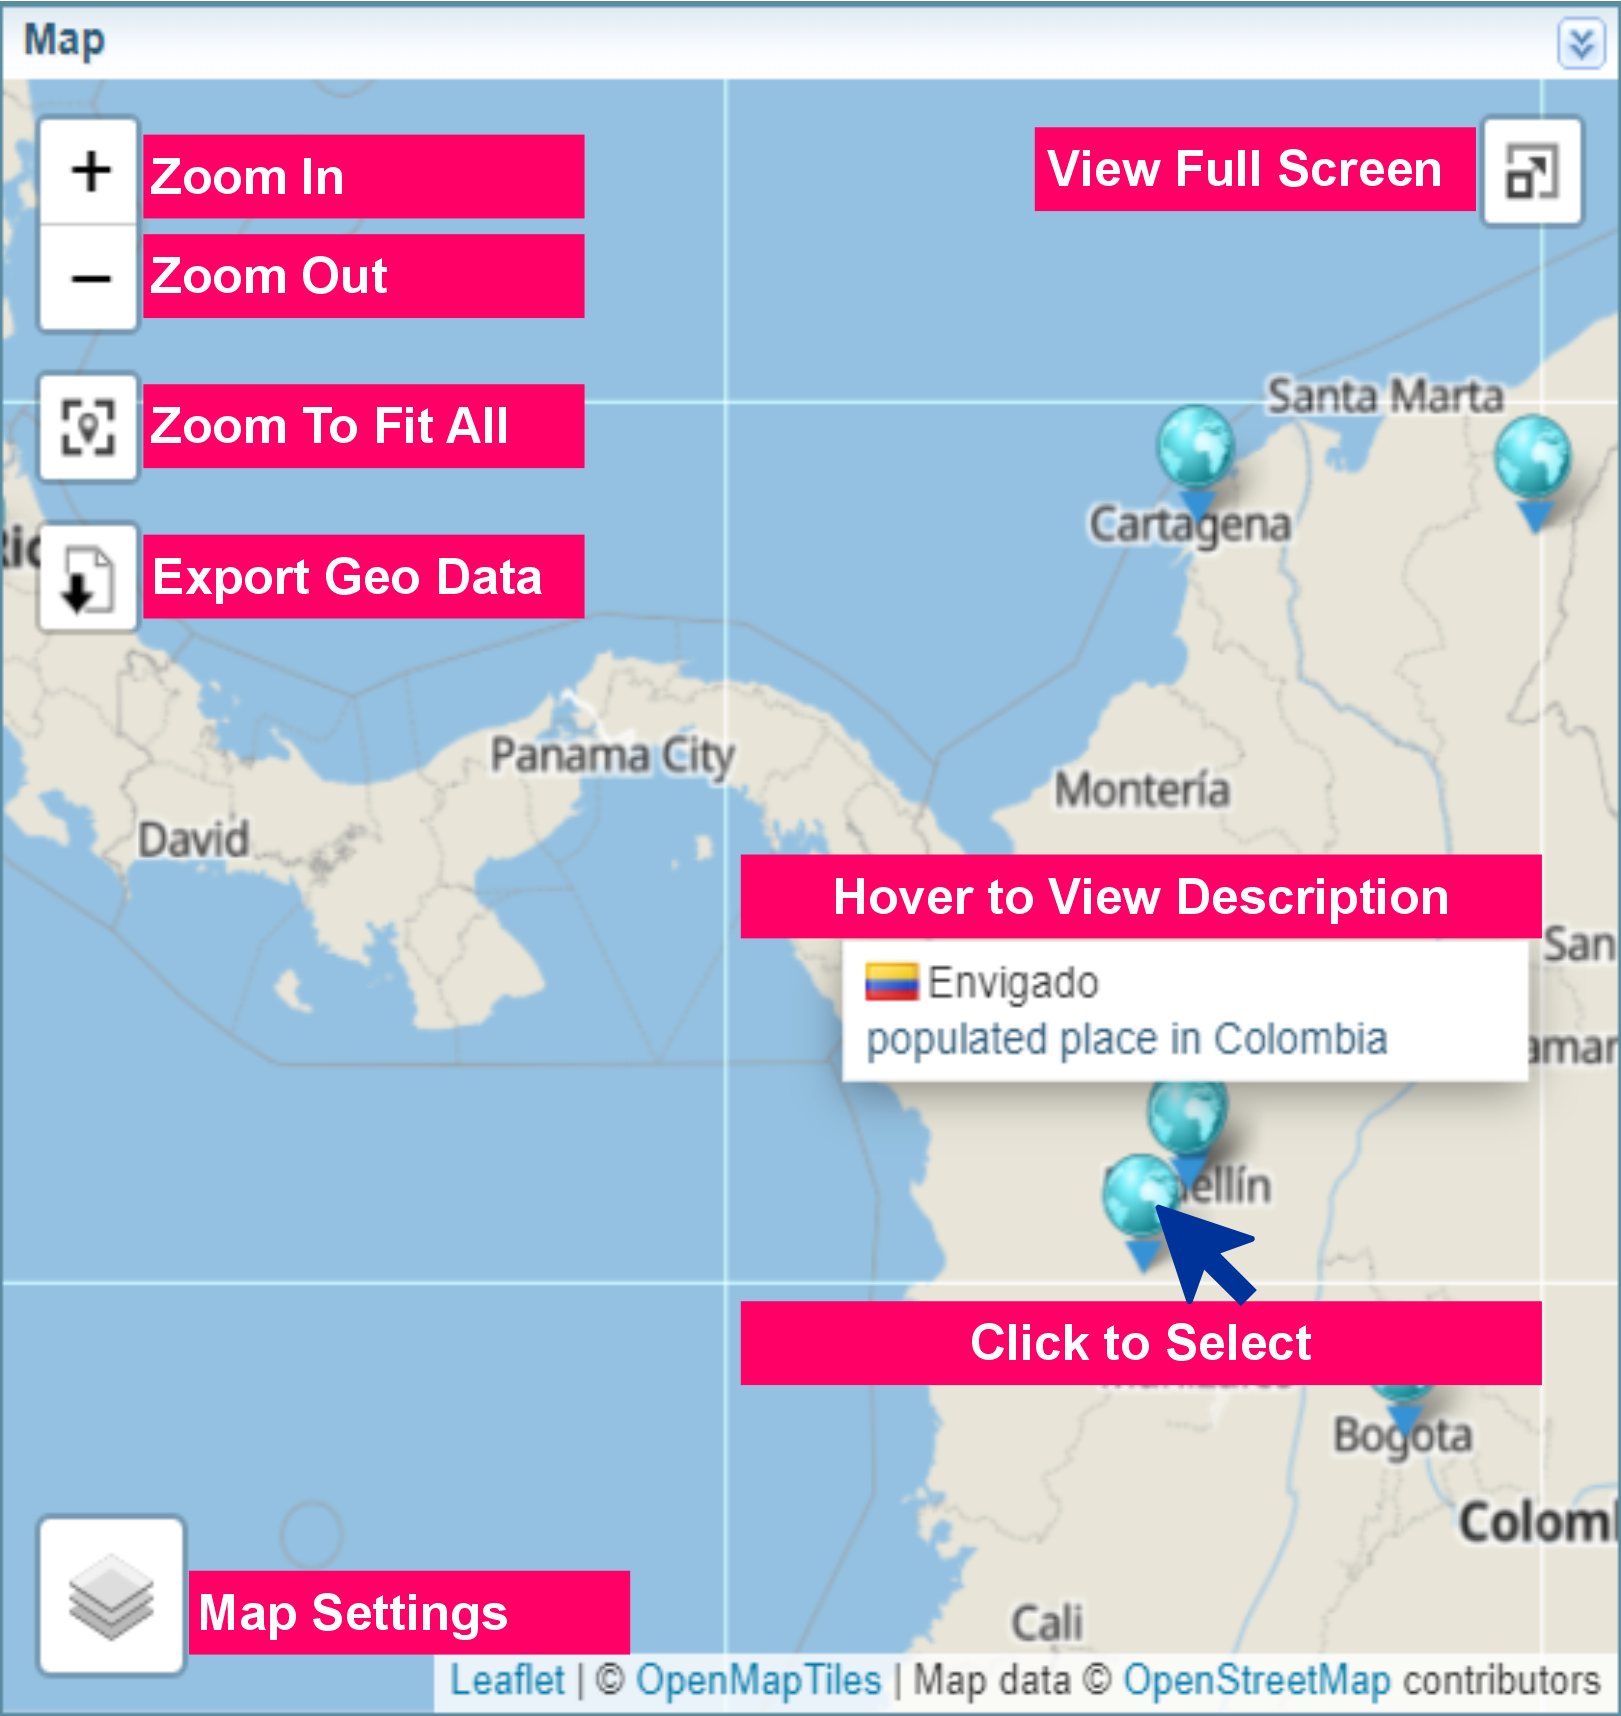
The controls displayed in the Map pane are described below.
Depending on how the map pane is accessed, all options may not be available.
|
|
à |
Zoom in and out of the map. |
 |
à |
Zoom to fit all the location markers within the map window. |
|
|
à |
Allows you to export the options into a KMZ or KML file. See Export Map Data. |
  |
à |
Allows you to enter and exit the map view in full-screen mode. |
 |
à |
Map Settings Hover over the maps icon to change the map settings.
|
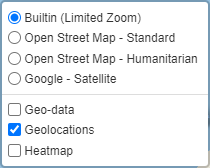
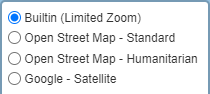
Type of MapYou can select different map views.
Some maps require an Internet connection to work. The map options shown may vary if custom map views have been connected to Sintelix. |
||
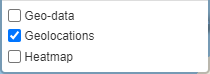
Map Data OptionsYou can choose what map data is displayed. You can choose more than one option.
The options displayed depends on the data available for display on the map. See Geo-data, Geolocations and Heatmaps for more information. |
||
 |
à |
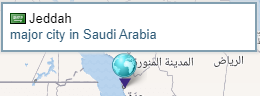
Hover over the location marker to view a pop-up with information about the location.
Network Graphs: When viewing the Map pane from the Network Graph pane, selecting a location on the map will select the location entity in the Network Graph. Clearing an entity node from the Graph will clear the location from the Map pane. |


Map Data Options
You can display different geographical information on the map, including geo-data, geolocations and heatmaps.
The options displayed depend on the geographical data available for display on the map.
You select more than one option at a time.
The following examples use same geographical data contained in geospatial file showing locations of historical shipwrecks.
Geo-data
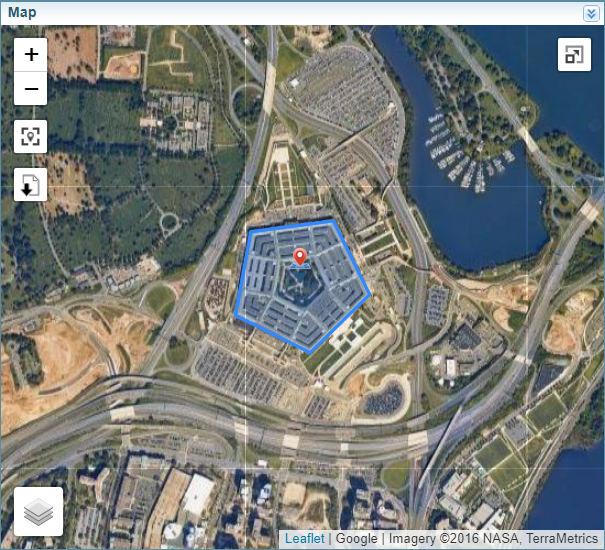
The Geo-data option shows the geospatial data, which can include points, paths or shapes. The example below only has point data available.
This option is only available when viewing information from a geospatial file.
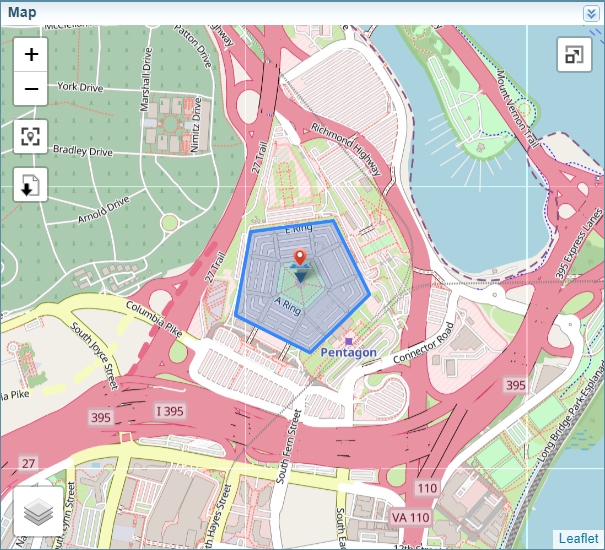
Maps showing a shape
This example shows an outline of The Pentagon using two different map settings.
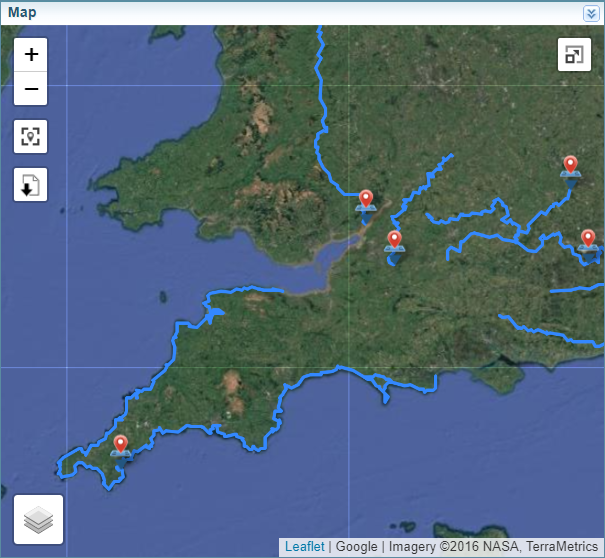
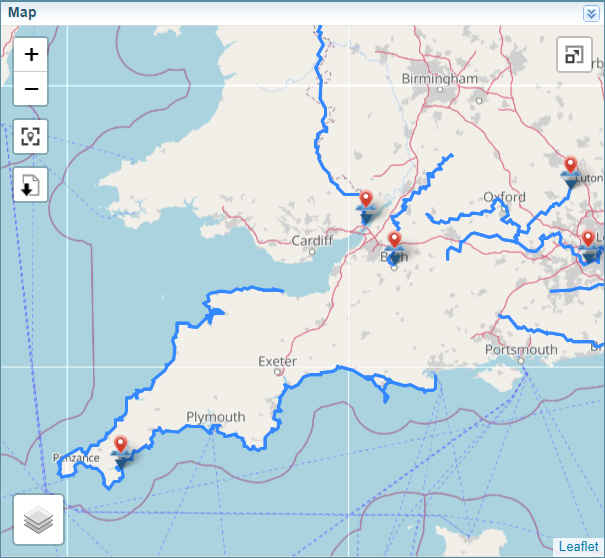
Maps showing a path
This example shows the path of national walking trails in England using two different map settings.
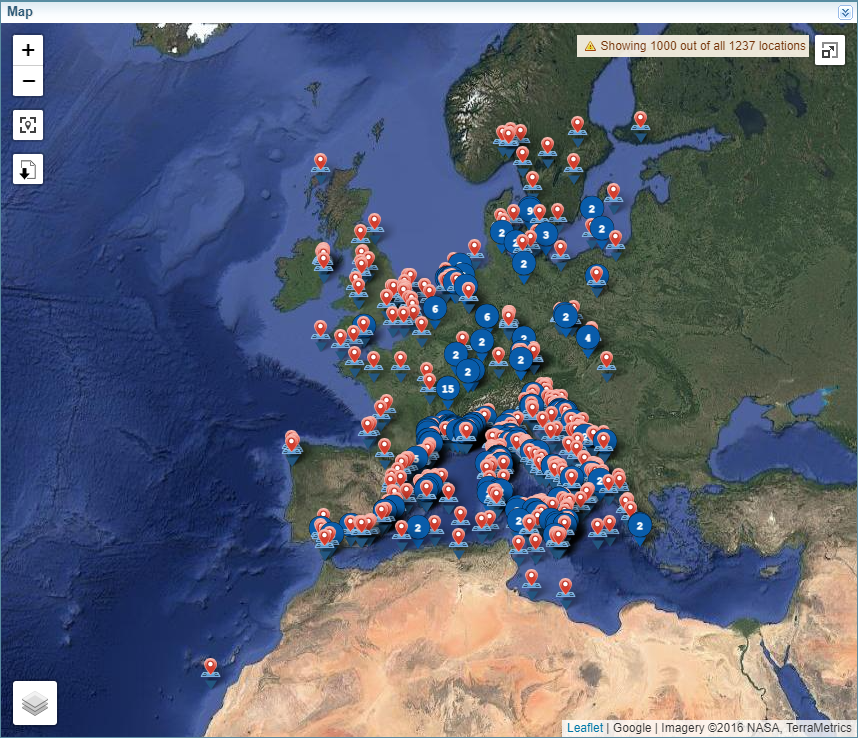
Geolocations
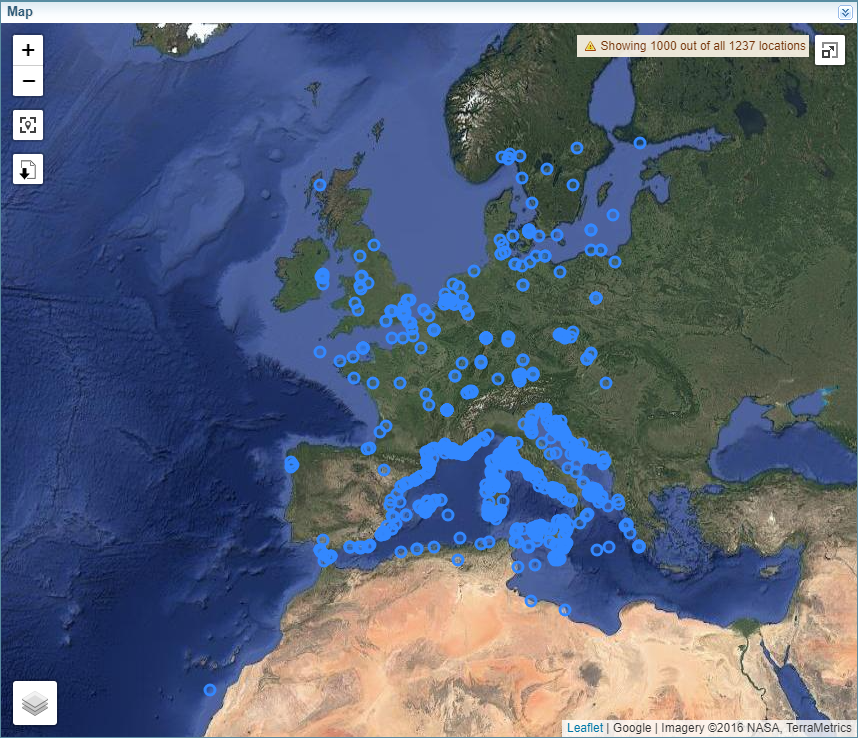
The Geolocations option shows location coordinates as a map marker.
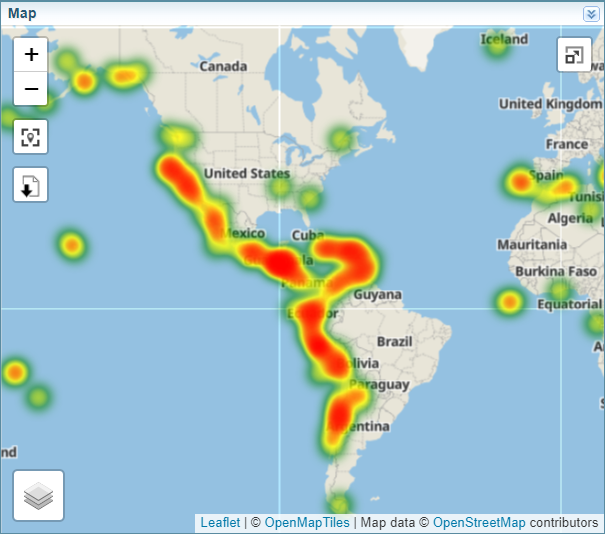
Heatmaps
The Heatmap option shows a visual representation of location density, in this case of historical shipwrecks. A heatmap is a useful way of visualising complex data or significant volumes of data.
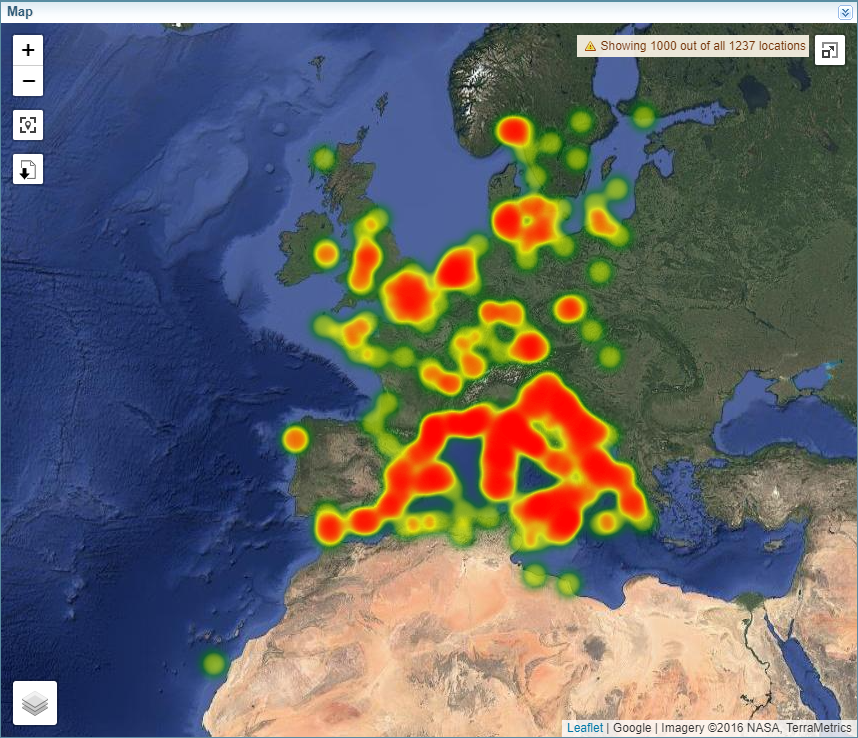
This example shows the a heatmap of historical earthquakes.
Heatmap showing a earthquakes