Maps
Quick Summary
Maps can display:
-
locations with a coordinates feature.
-
Geospatial Files containing geographical data ingested as a document.
Locations
As documents are ingested into Sintelix, the geographic locations in the documents are identified. Sintelix cross-references location names with an internal database, then assigns geocoordinates (latitude and longitude) to each location.
When a Network is generated, location entities are created. You can view these locations on a map.
Geospatial Files
Geospatial Files can be ingested into a Collection.
When a Network is generated, geo-data entities are created. You can view the geo-data on a map.
You can try importing sample Geospatial files. See Geospatial Files Example.
Access
There different ways to access maps, including when viewing:
-
Documents: Select the
 Geo-locations dropdown or select a location entity in the document à
 -
Network Tables: Select
Show Locations from the action menu or select the globe icon in a coordinates column à -
Network Graphs:
-
Select
Show Map Pane from the menu à -
Select Map from the Network Graphs Layouts menu to overlay Graph nodes on a map à
-
-
Network Timelines : Select the
Show Map option à -
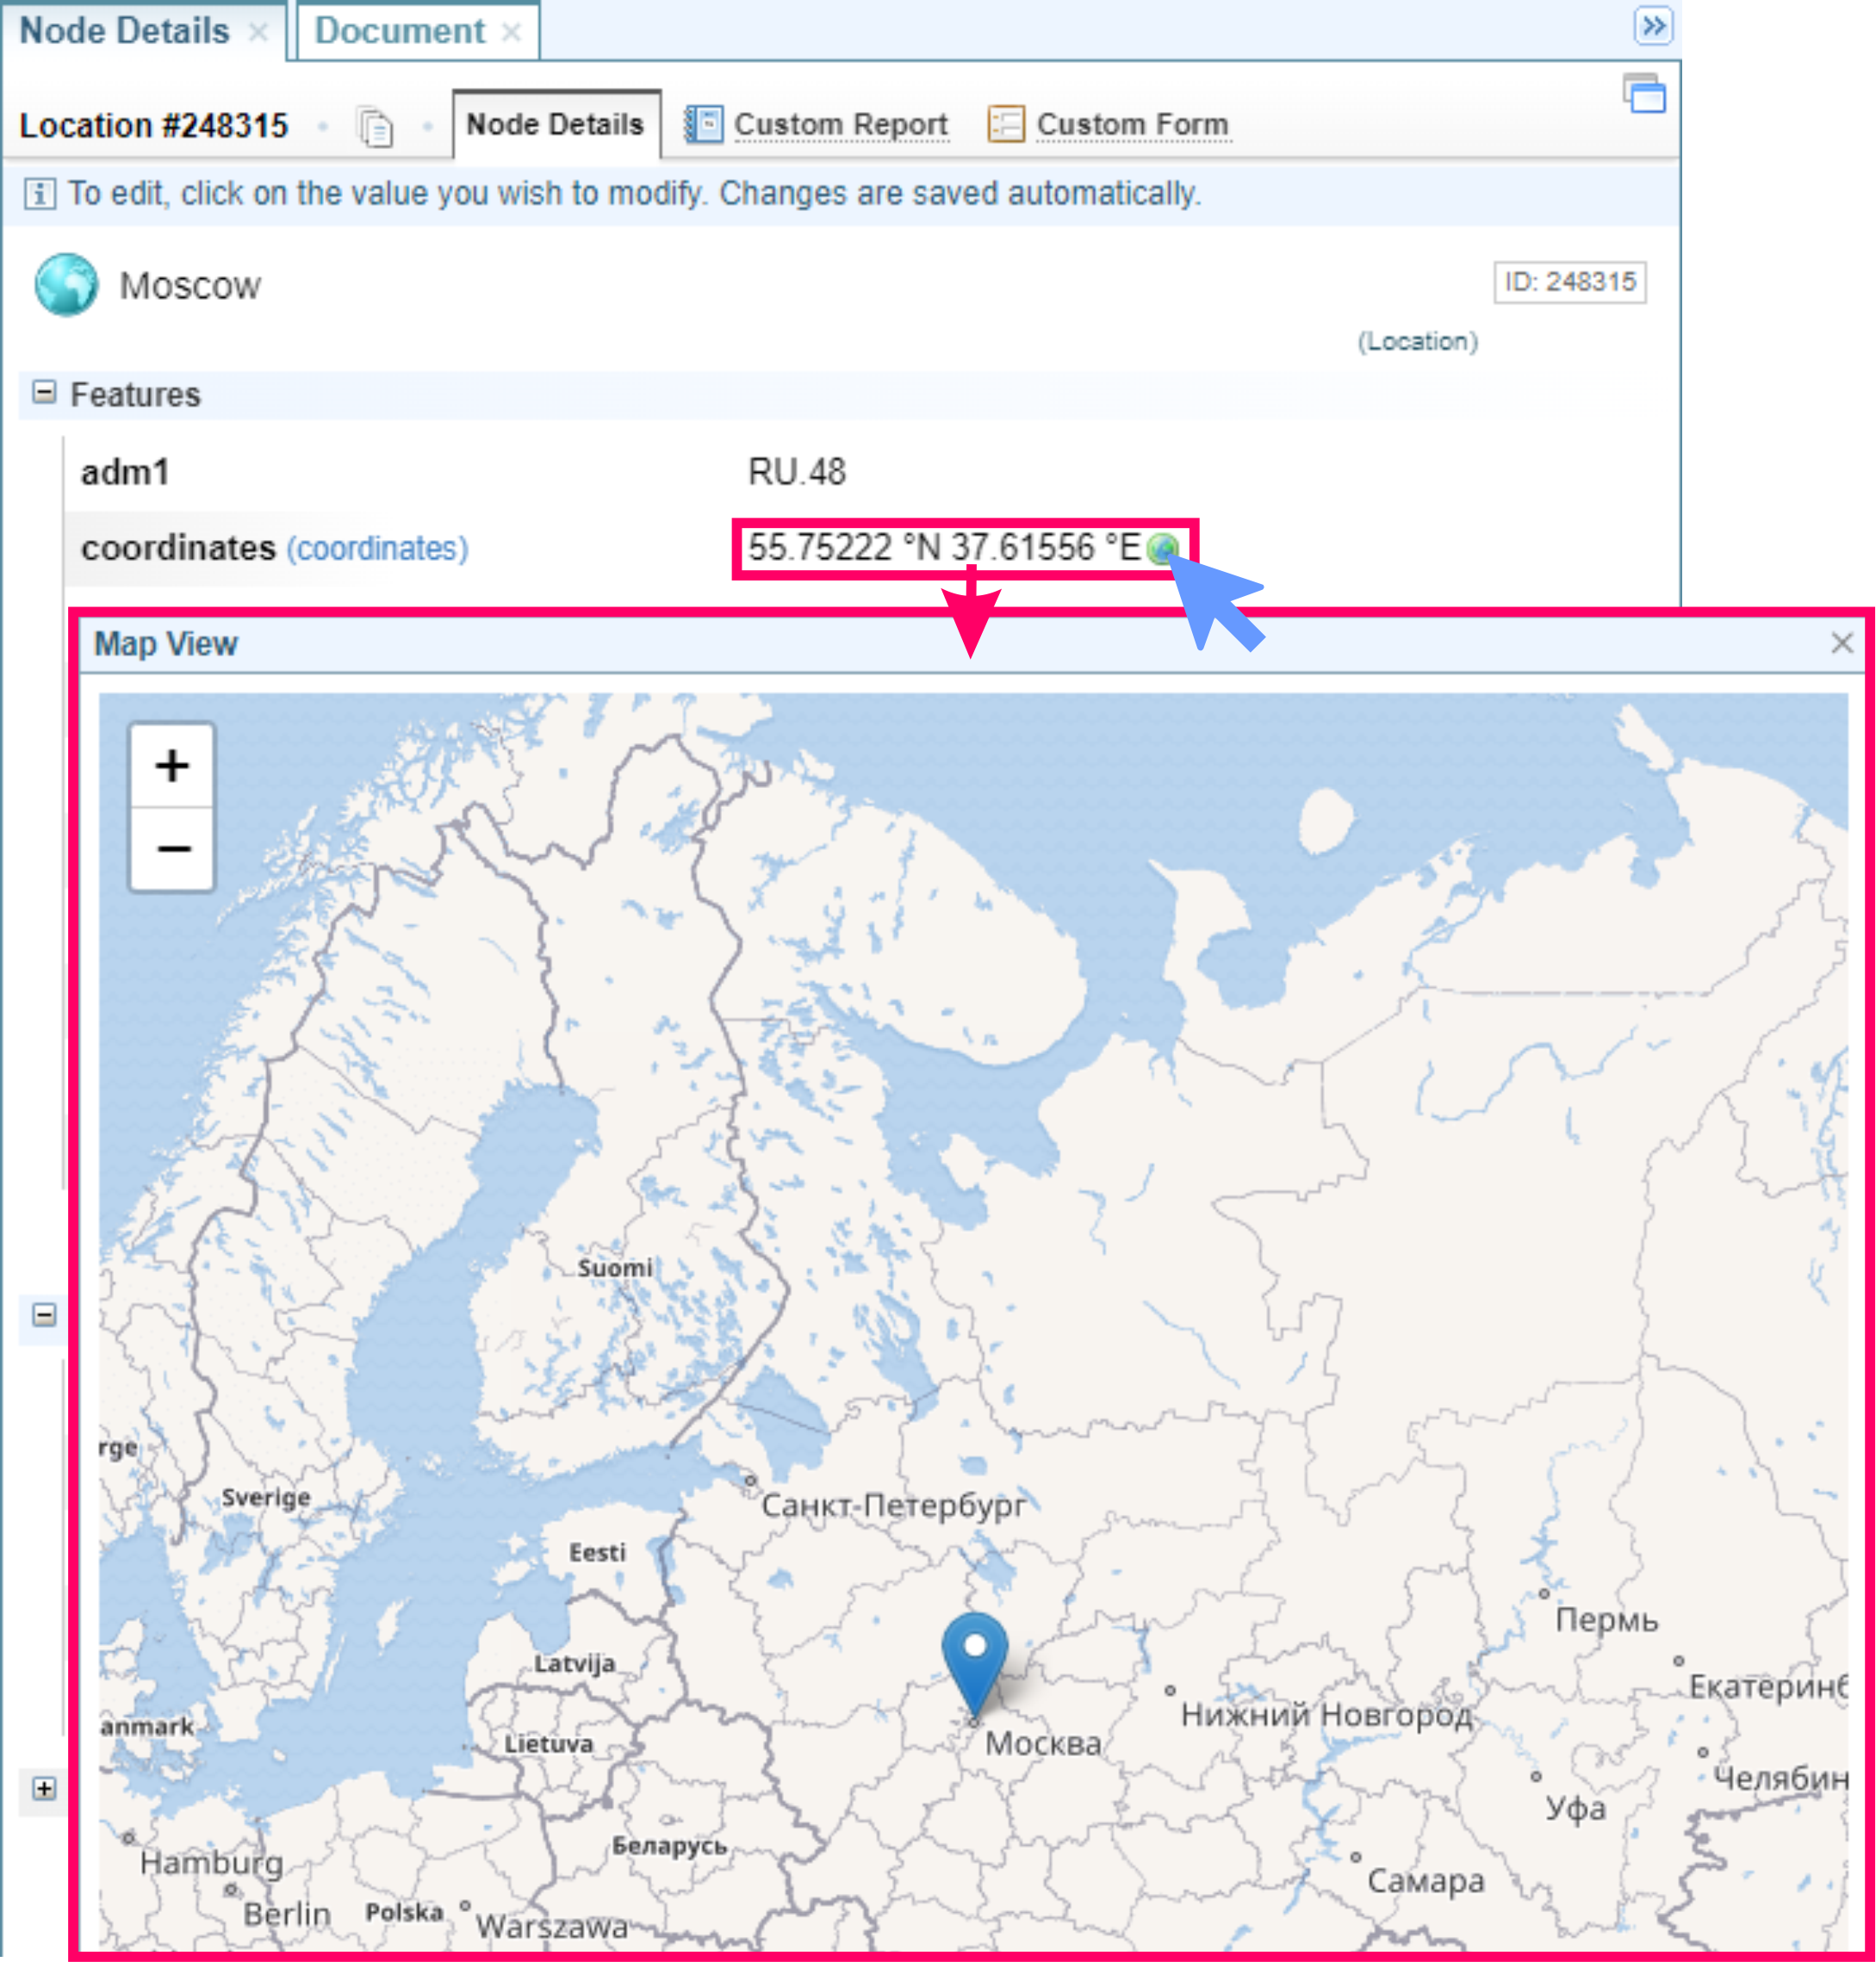
Node Details : Select the
Show Map symbol in a coordinates field à
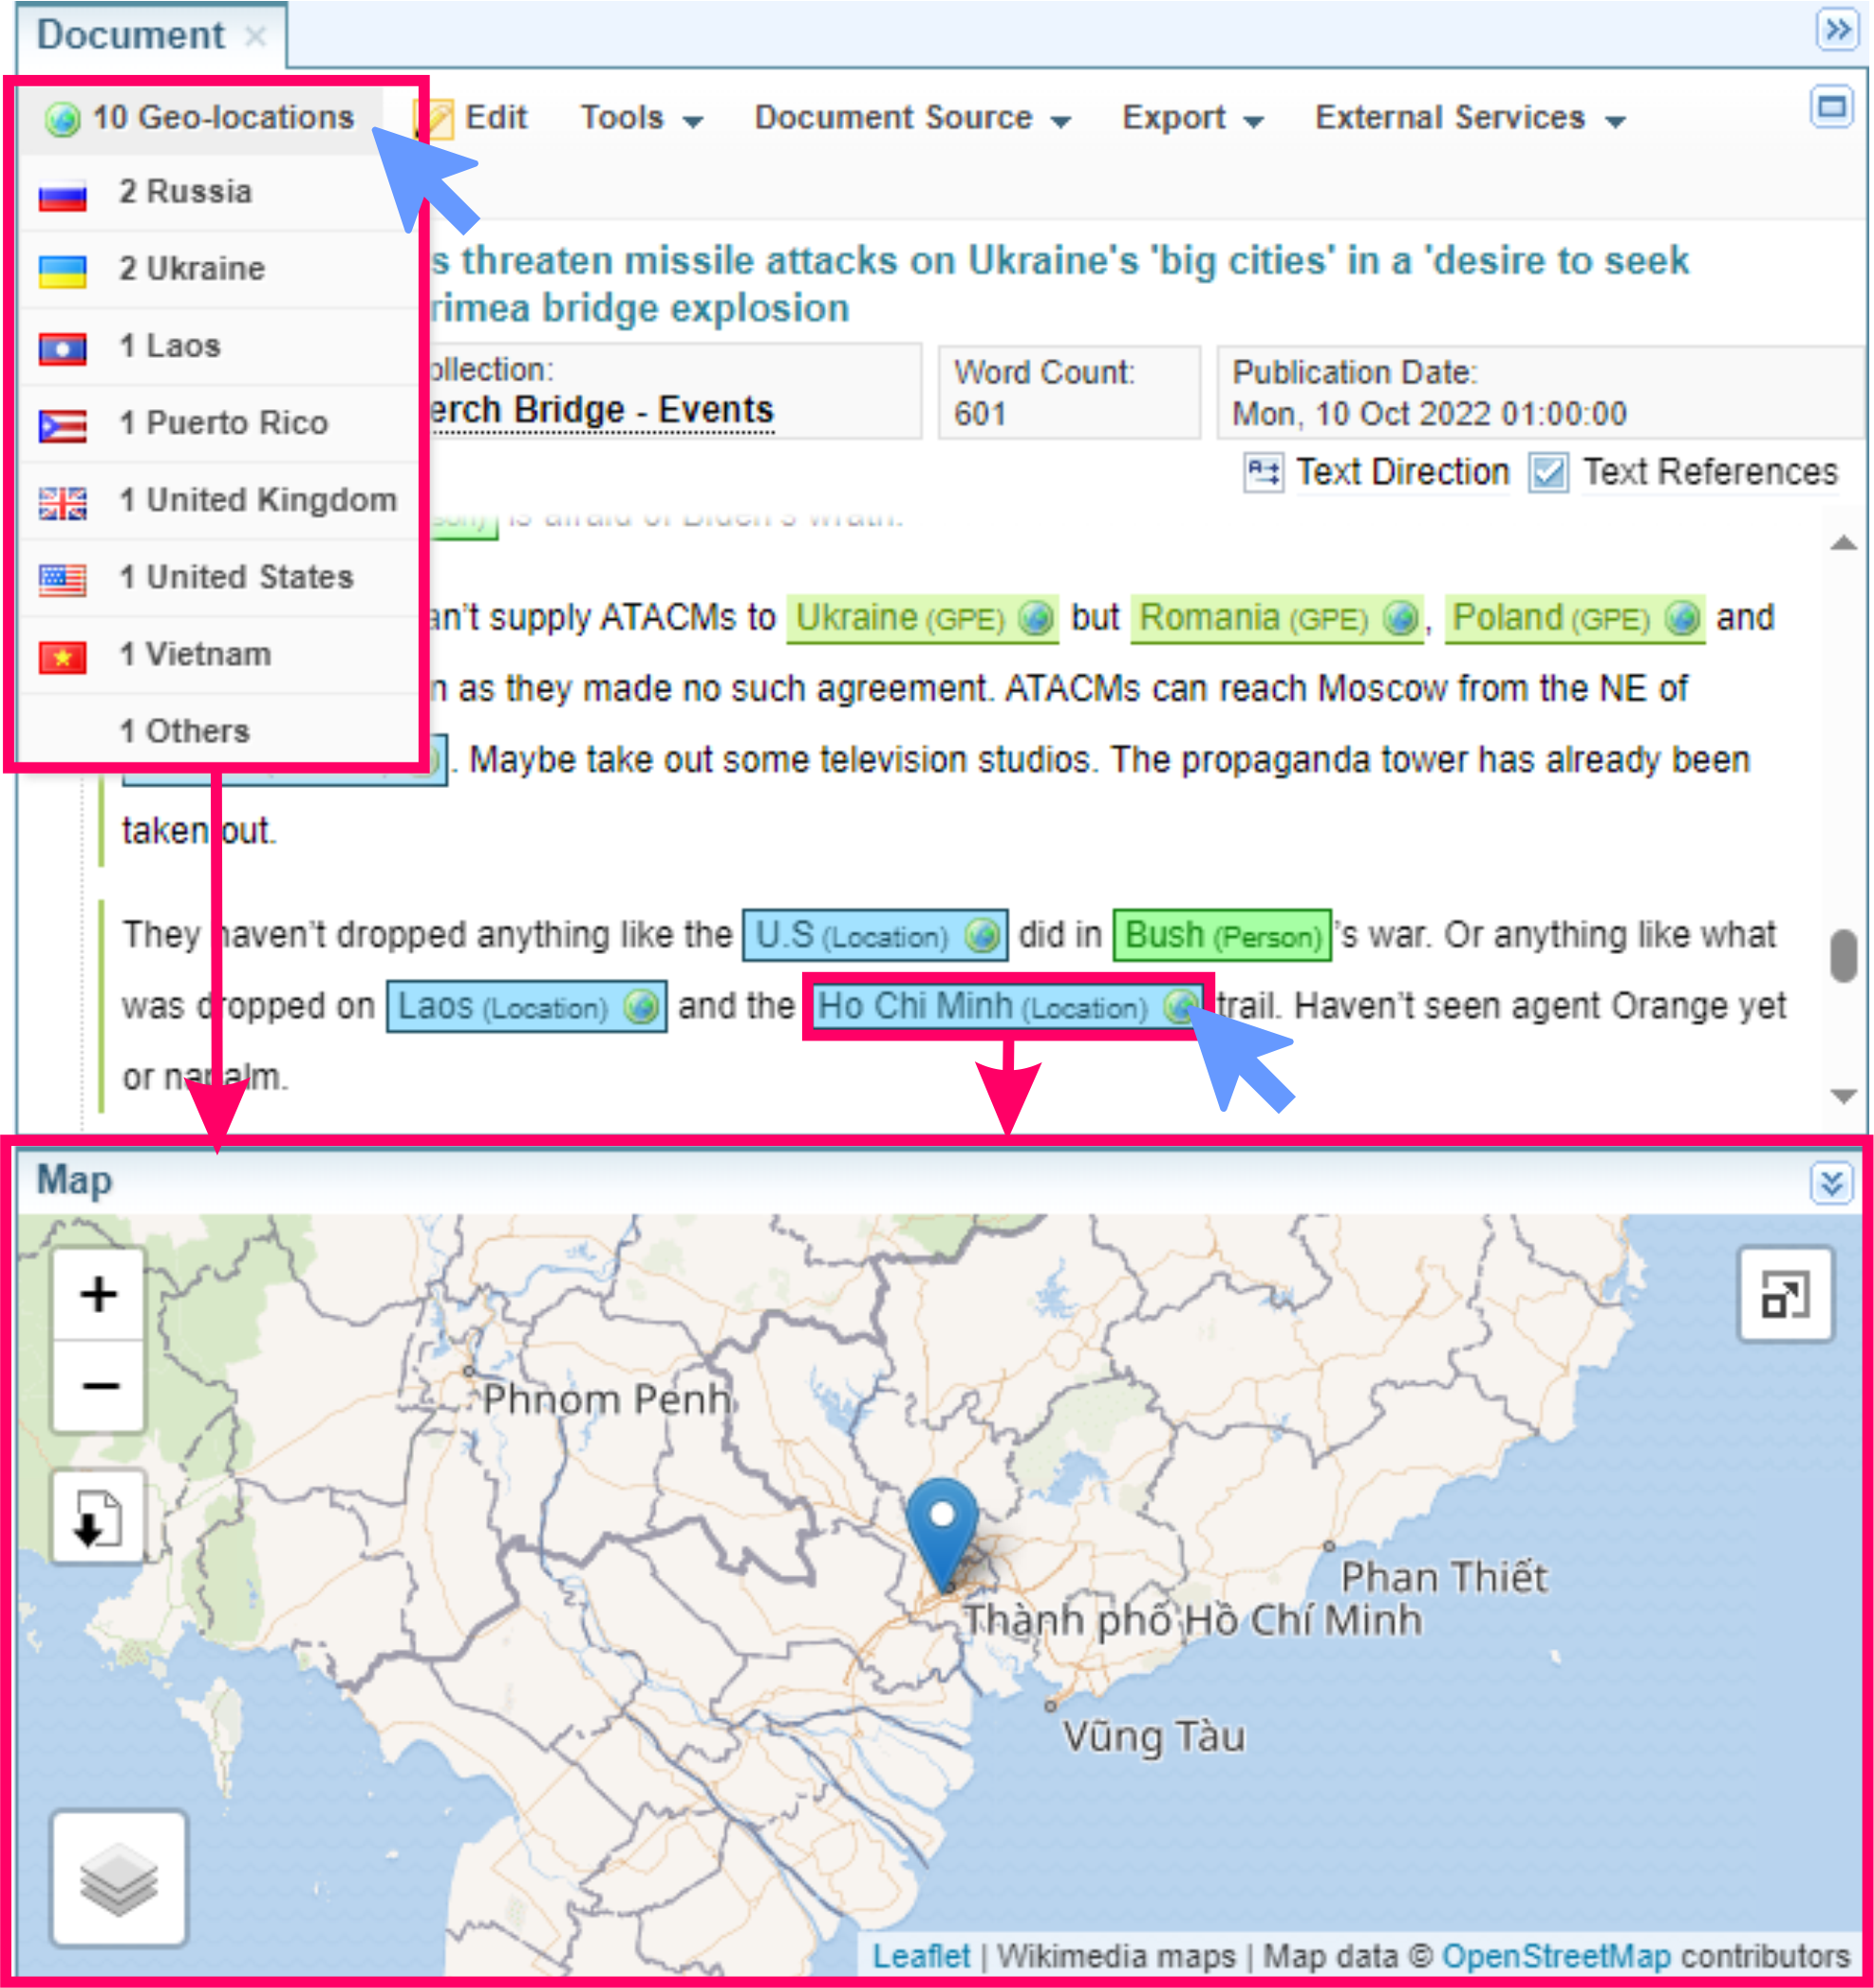
Document: Show Map
When viewing a document in the Document pane, you can view the map view by selecting:
-
the
Geo-locations dropdown - selecting the top option shows all locations in the map, alternatively you can select from a country list to just show that country location. -
a
location entity in the document to open a Map View showing the selected location.
Network Table: Show Map
When viewing Network Tables, you can:
-
select
Show Locations from the action menu to open the Map - Table pane showing locations linked to that entity.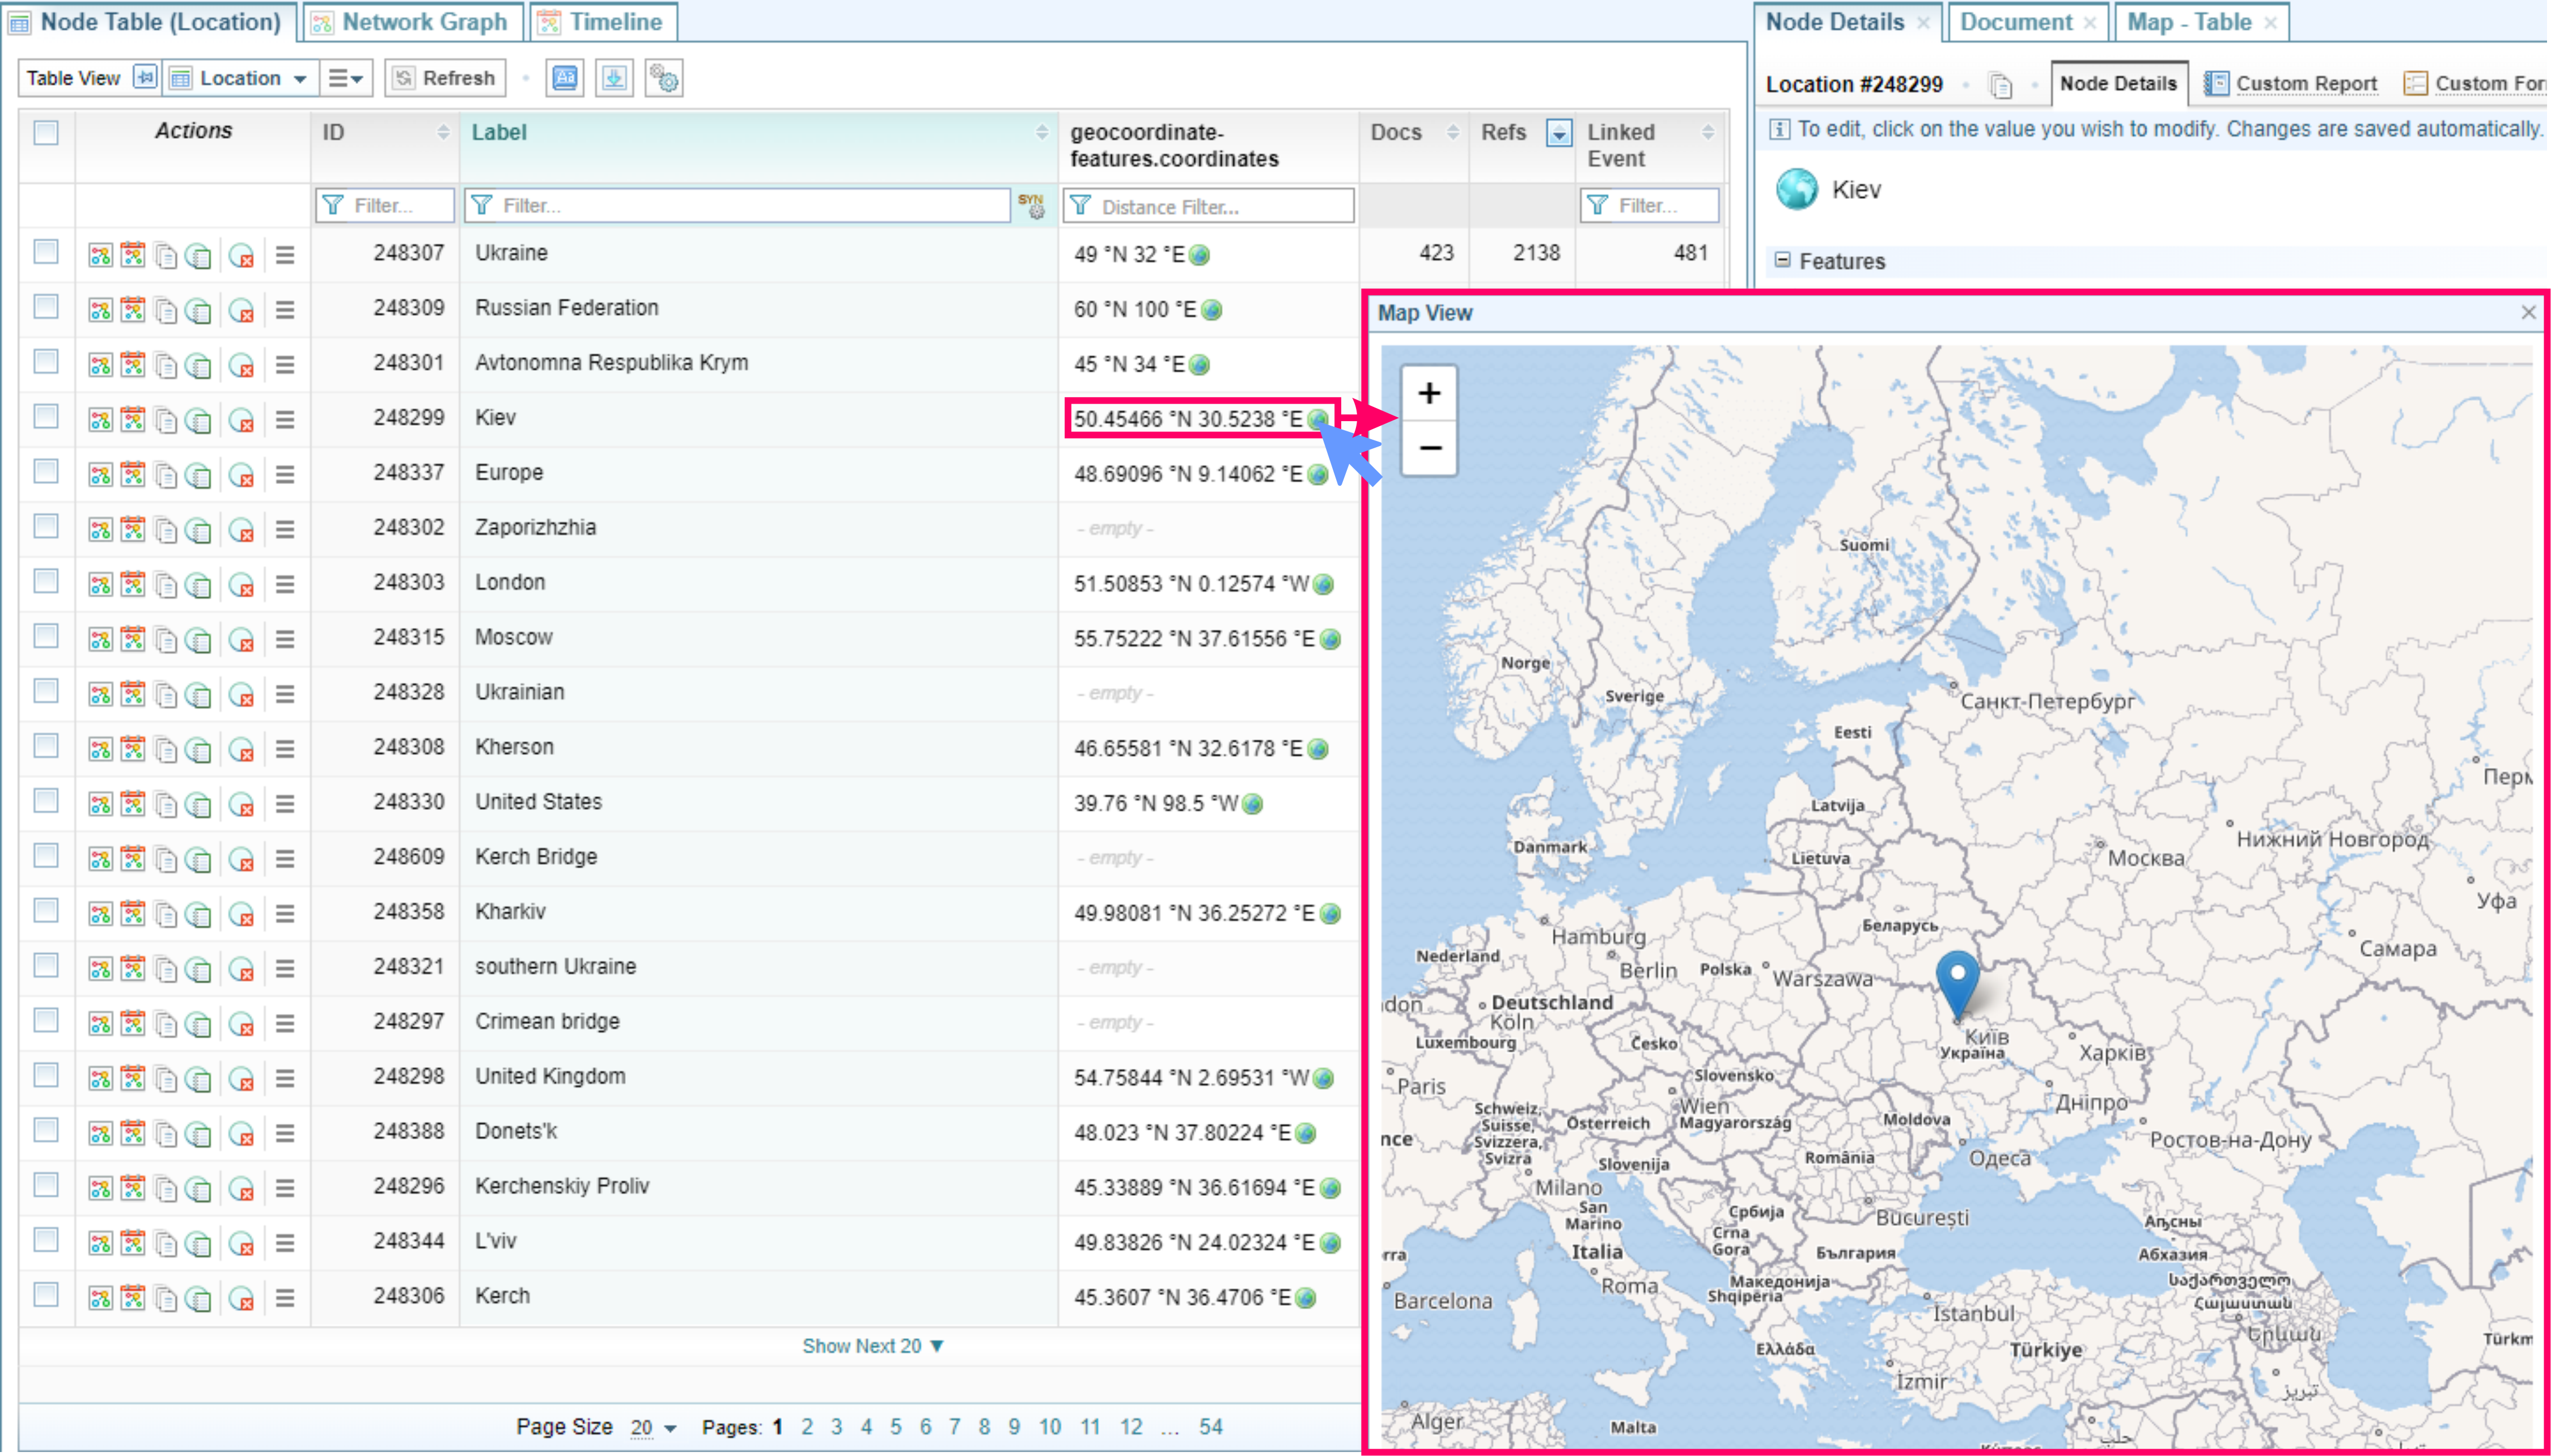
-
select the globe icon
in a coordinates column to open the Map View dialog showing the selected location.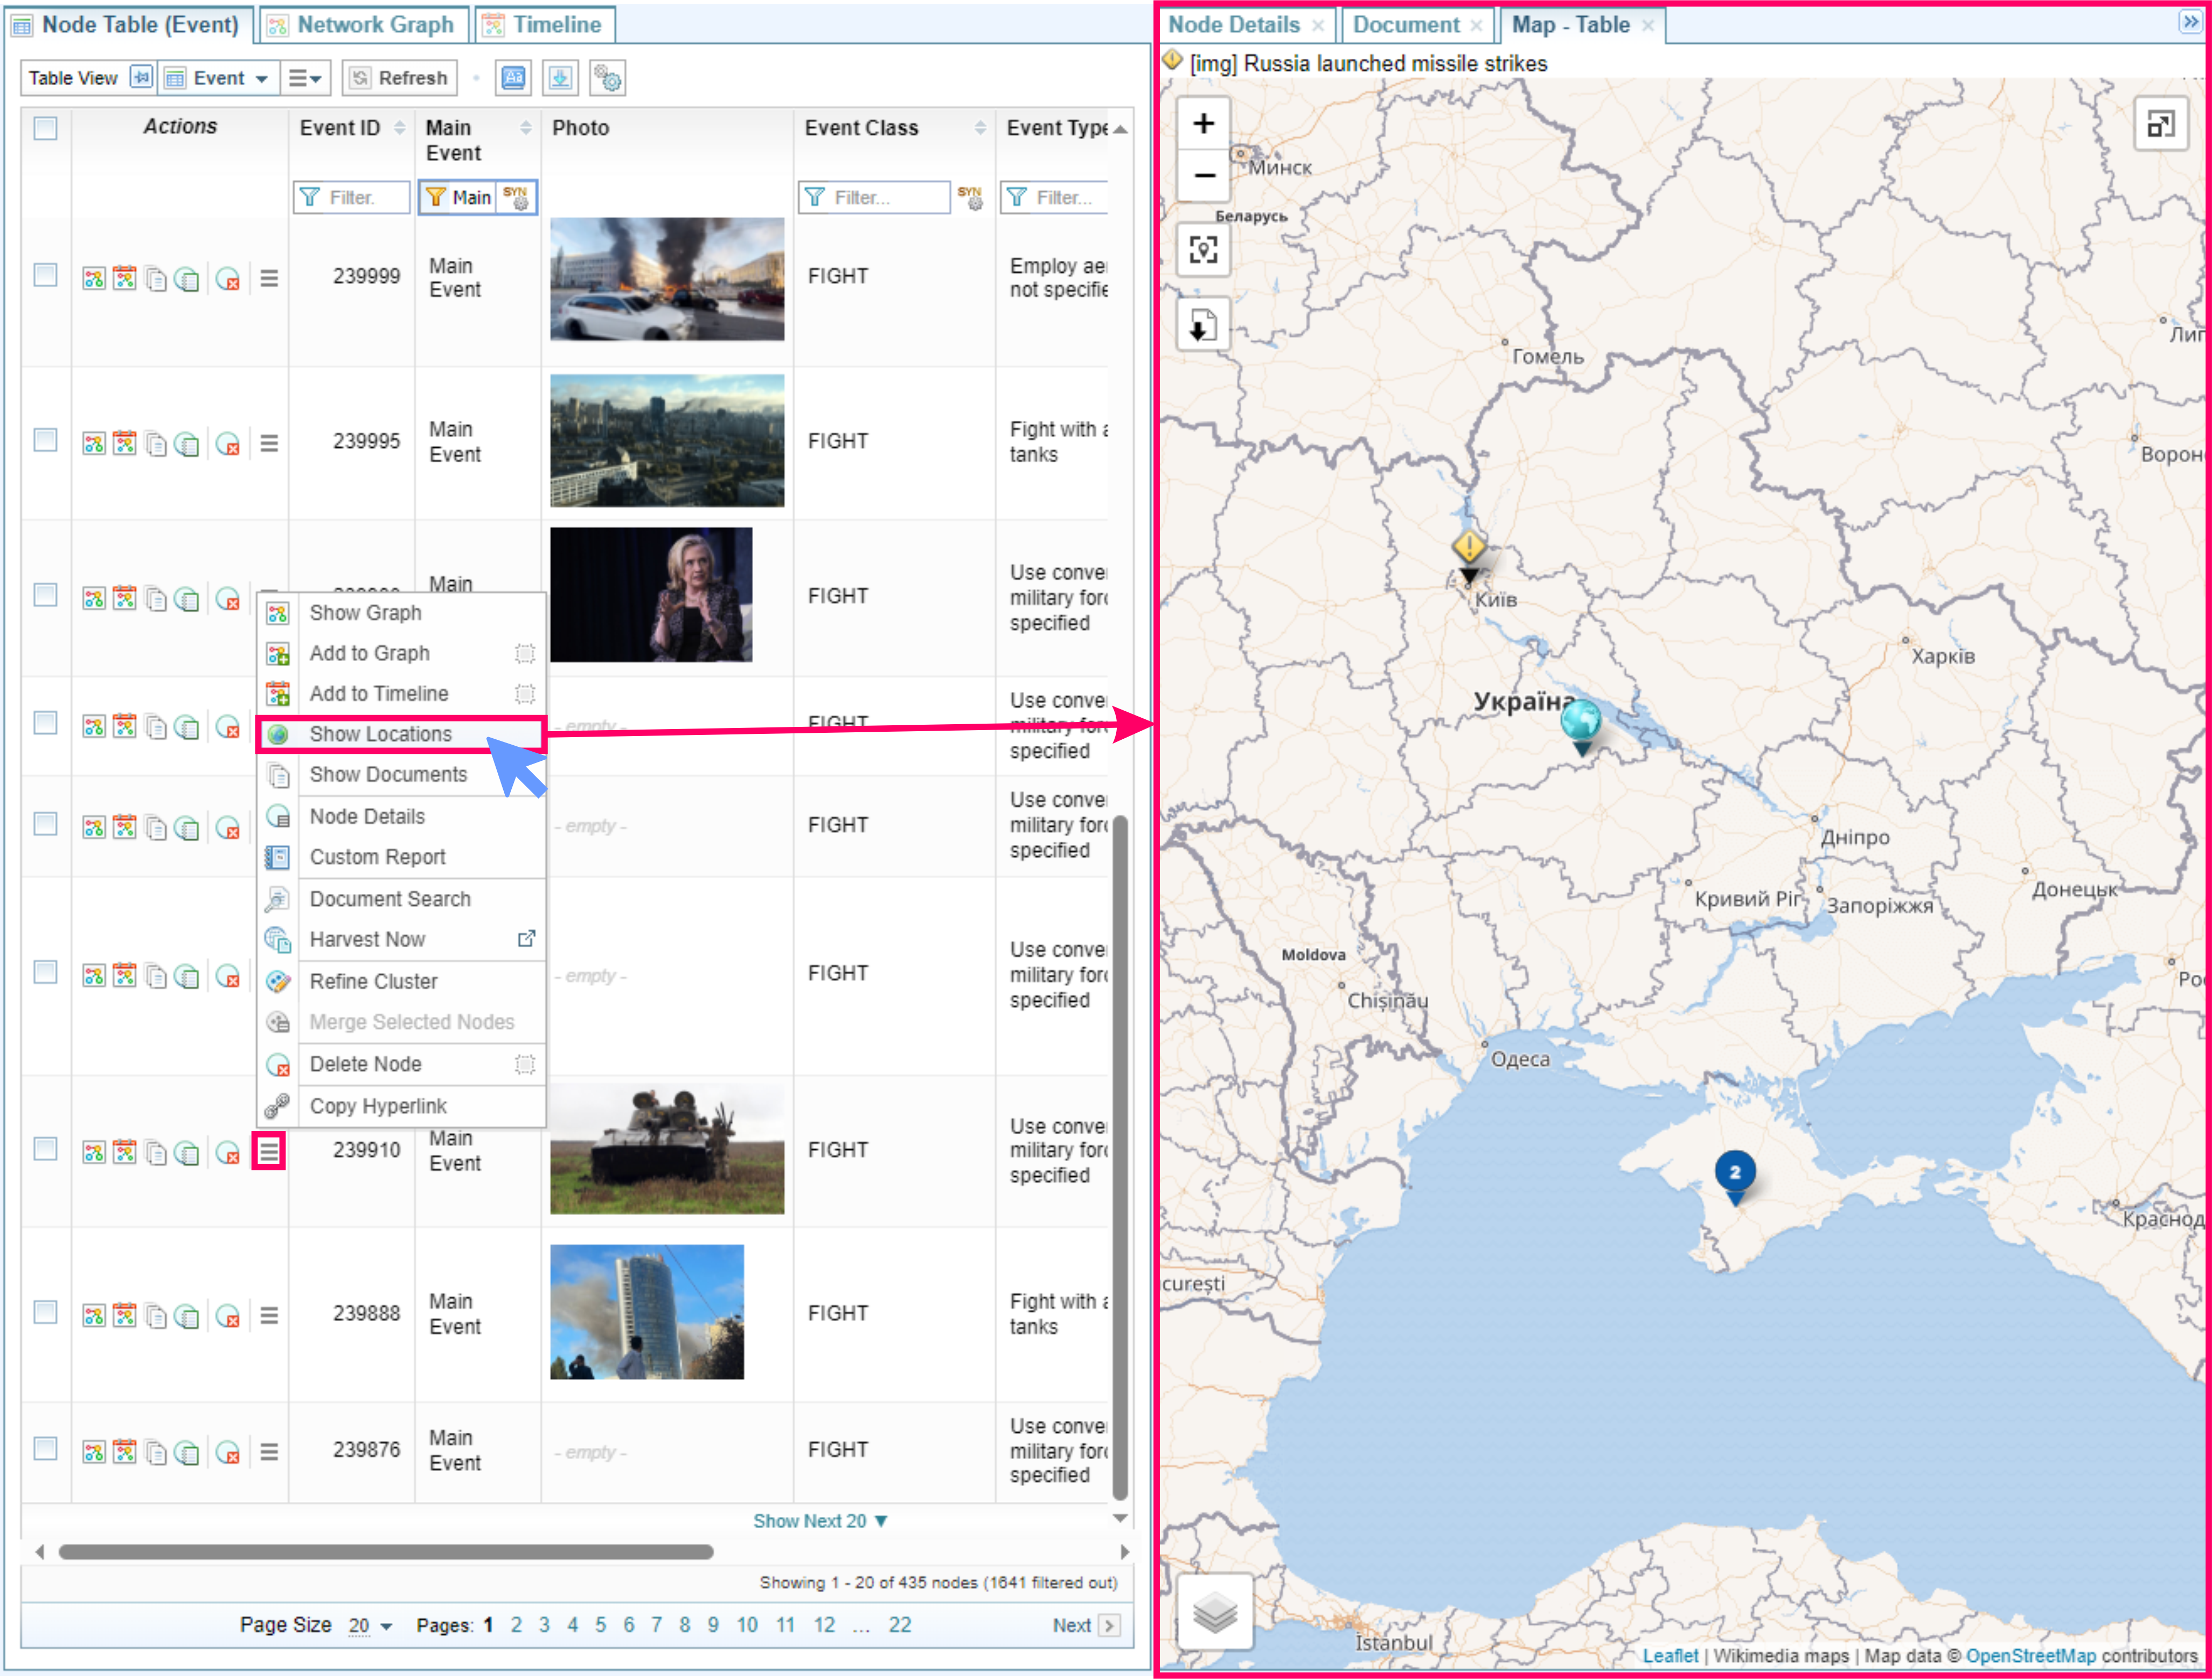
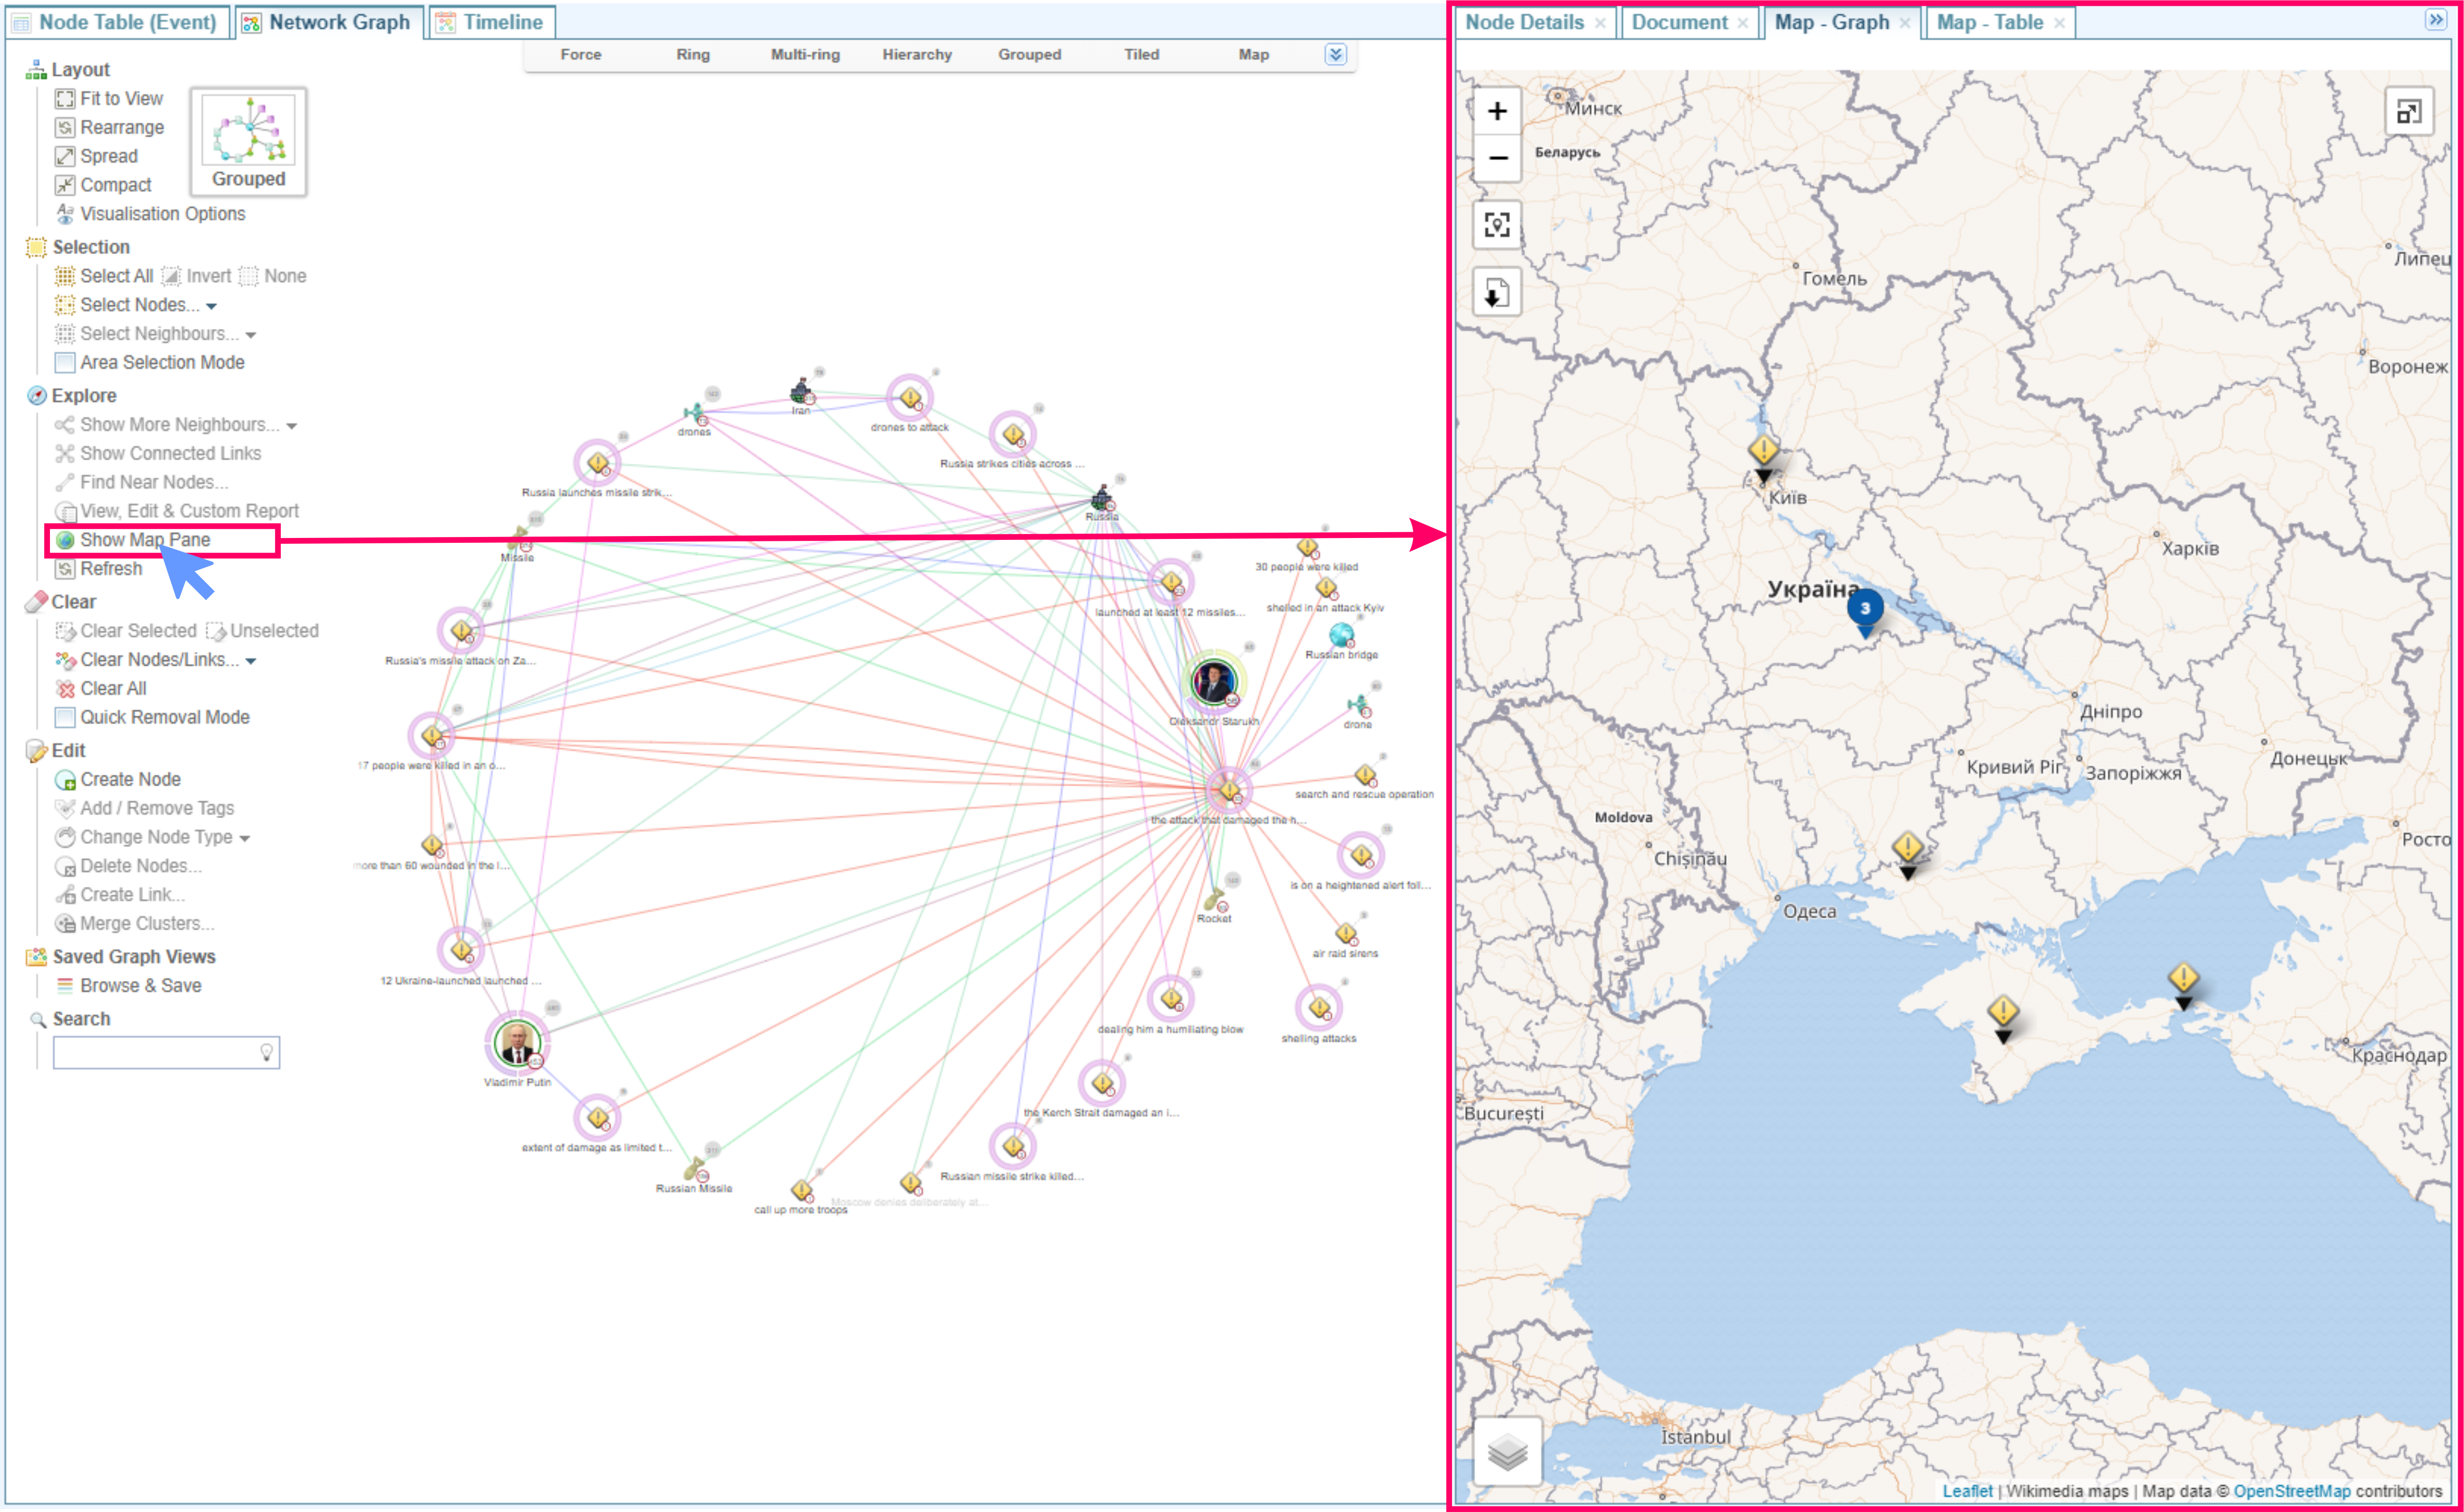
Network Graph: Show Map
When viewing a Network Graph you can select ![]() Show Map Pane from the menu to open the Map - Graph pane showing locations included in the current graph.
Show Map Pane from the menu to open the Map - Graph pane showing locations included in the current graph.
As you make changes to the Network Graph, by adding or removing nodes, the Map View will be updated.
Selecting a location on the map will select the related nodes in the Network Graph.
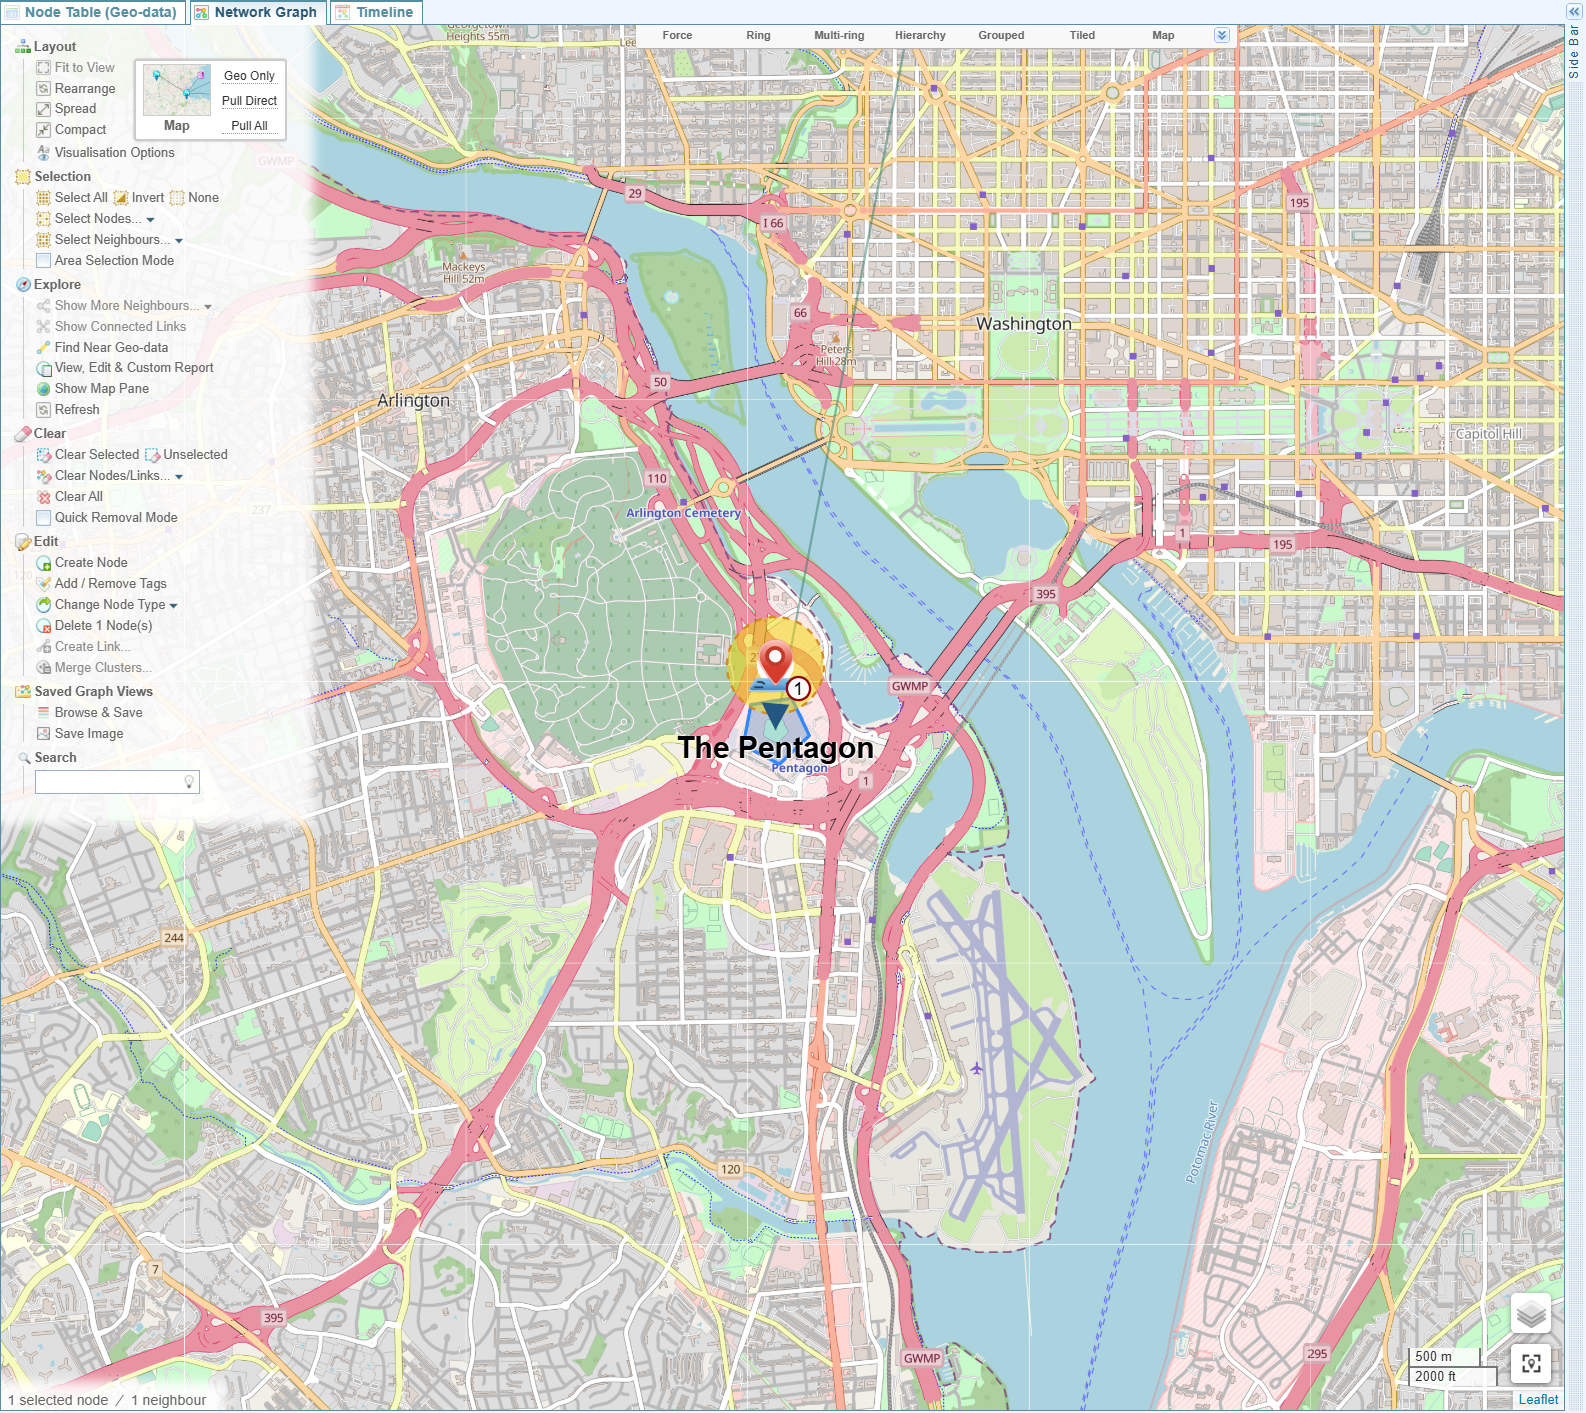
Network Graph: Map Layout
When viewing a Network Graph you can select Map from the Network Graphs Layouts menu to overlay Graph nodes on a map.

As you make changes to the Network Graph, by adding or removing nodes, the Map Layout will be updated.
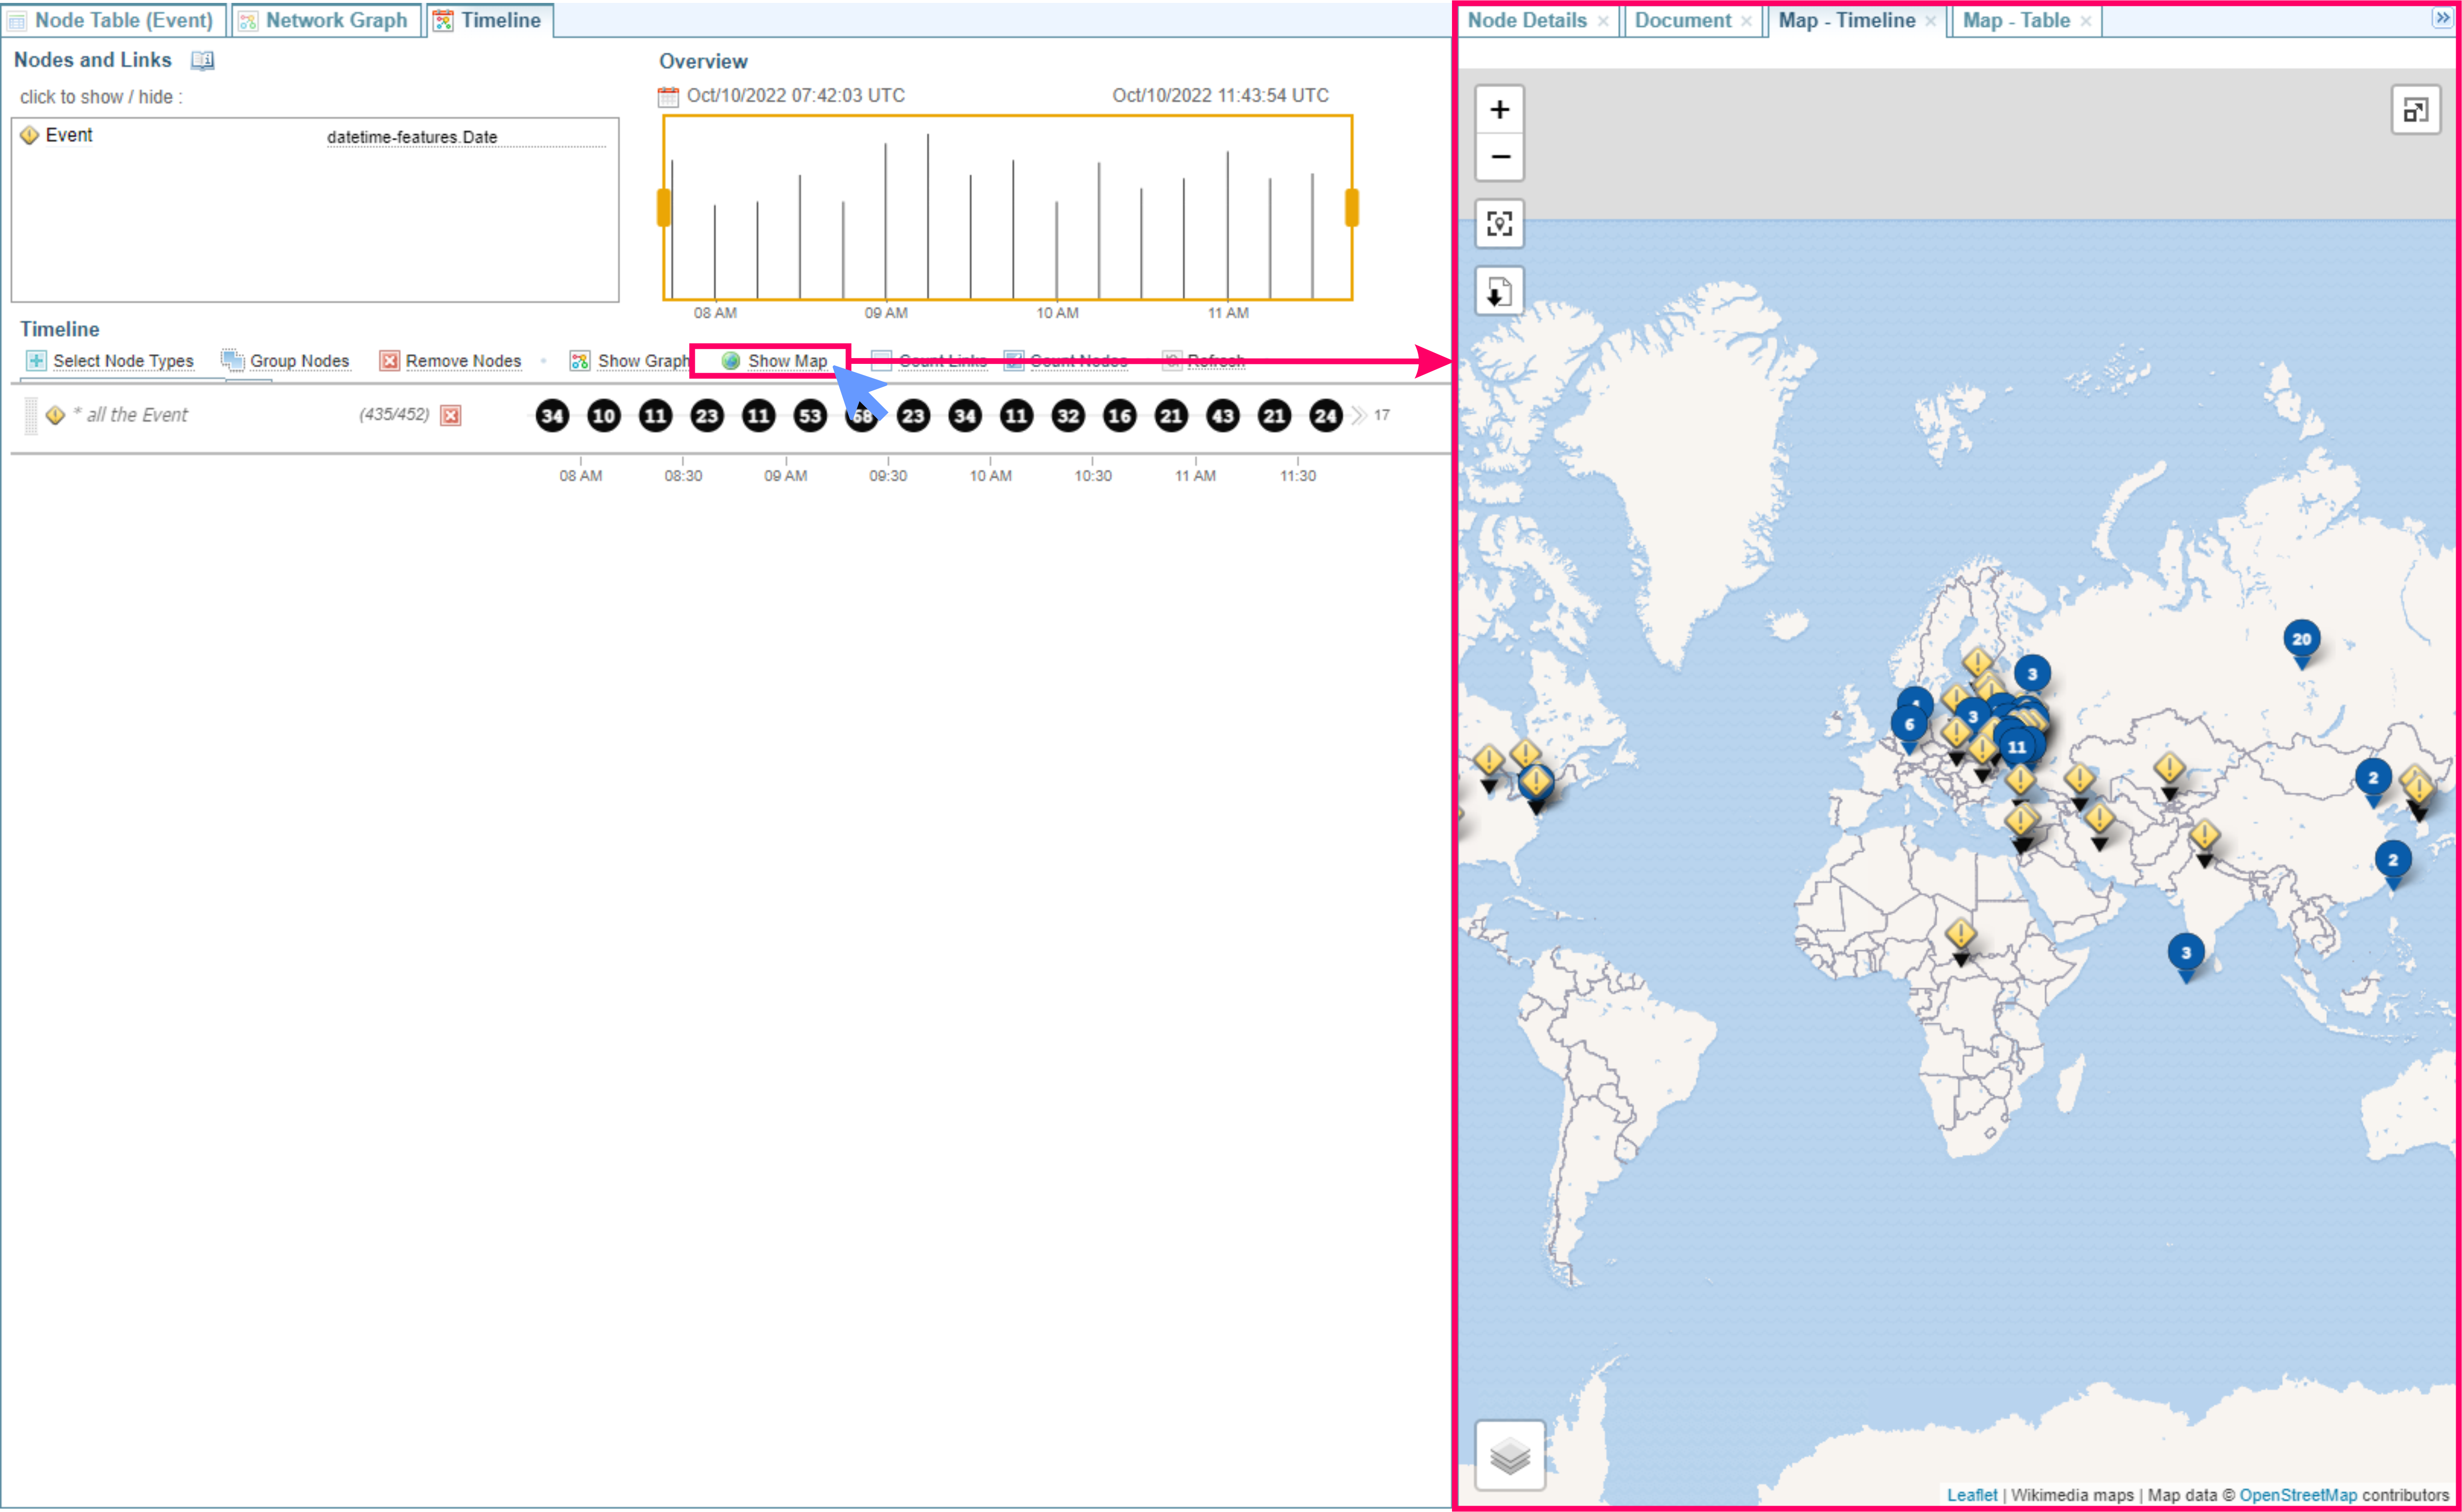
Network Timeline: Show Map
When viewing a Network Timeline you can select the ![]() Show Map option to open the Map - Timeline pane showing locations included in the current timeline.
Show Map option to open the Map - Timeline pane showing locations included in the current timeline.
As you make changes to the Time, these changes will be reflected in the Map View. For example, if you zoom in and out of a timeline, the locations displayed on the Map View will be adjusted.
Node Details: Show Map
When viewing Node Details you can select the ![]() Show Map symbol in a coordinates field to open the Map View dialog showing locations included in the current timeline.
Show Map symbol in a coordinates field to open the Map View dialog showing locations included in the current timeline.